
Research on Control of Human Gene Expression
Introduction
Jay Brown
Emeritus Professor Department of Microbiology, Immunology and Cancer Biology University of Virginia School of Medicine
This site describes current research in Jay Brown’s laboratory in the Department of Microbiology, Immunology and Cancer Biology at the University of Virginia School of Medicine. Research is focused on regulatory mechanisms that affect synthesis of messenger RNA specific for protein coding genes as it occurs in human cells. The field is a large one as there are many biochemical mechanisms that affect gene expression. These are familiar and include promoters, enhancers, histone modifications, chromatin structure and other features.
In view of the many factors that affect transcription, I have found it productive to break the overall problem down into sub-sections and focus on individual features. The idea is to begin with a restricted database of genes that appear attractive to probe a particular system, such as transcription factors, and confine the analysis to the target system. The strategy has been found to have merit, and here are described three studies where it has been implemented. They are: (1) the role of gene length in controlling the number of times a gene can be transcribed in a given time; (2) identification of transcription factors involved in suppressing rather than activating gene expression; and (3) the way promoters are organized to make their function resistant to the effects of mutations in their DNA. Greater detail is provided below for each of the three studies.
1. Role of gene length in regulating the level of human gene expression
Role of Gene Length in Control of Human Gene Expression: Chromosome-Specific and Tissue-Specific Effects
Learn MoreThis study was carried out to pursue the observation that the level of gene expression is affected by gene length in the human genome. As transcription is a time-dependent process, it is expected that gene expression will be inversely related to gene length and this is found to be the case. One can be quantitative about the expected gene length/gene expression relationship. RNA polymerase II synthesizes RNA at a rate of ~1500 nucleotides/minute. At that rate, a human gene of average length (~50,000 nucleotides) would require more than 30 minutes to complete. For an unusually long gene of 1,000,000 nucleotides, the transcription time would be greater than 10 hours.
The effect of gene length on gene expression was examined by comparing broadly expressed with tissue targeted human genes. The distinction between the two is an important one that applies to all organisms with more than a single tissue (metazoans). Broadly expressed, also called housekeeping genes, are those expressed in all tissues. Tissue targeted genes are also known by different names, including genes with biased expression, developmentally regulated genes and genes with selective tissue expression. These genes differ from broadly expressed ones because they are not expressed in one or more tissues. The human gene GBP7, for instance, is expressed in only one tissue, liver.
The study was carried out with a database of 3538 human genes. Of these, 2413 and 1125 were judged to be tissue targeted and broadly expressed genes, respectively. Gene lengths and expression levels were downloaded from the UCSC Genome Browser (https://genome.ucsc.edu/). The study began by sorting all database genes into short (<15kb), midlength (15kb-100kb) and long (>100kb) groups. Gene expression was then plotted against gene length for broadly expressed and tissue targeted genes separately.
The result is shown in Figure 1 where gene expression (y-axis) is plotted against gene length (x-axis) for broadly expressed (red points) and tissue targeted genes (black points). The figure shows the expected inverse relationship between gene length and expression in both broadly expressed and tissue targeted genes with the slope being higher in the case of tissue targeted. There is as yet no agreement about the interpretation of this result. Perhaps there is extra regulatory machinery (e.g. transcription factors) required for synthesis of tissue targeted genes and this causes enhanced expression of short genes but decreased expression in long ones.
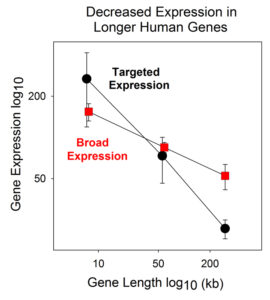
Figure 1: Plot showing the relationship between gene expression and gene length in broadly expressed (red) compared to tissue targeted human genes (black). Note that the line is steeper in the case of tissue targeted genes.
Role of Gene Length in Control of Human Gene Expression: Chromosome-Specific and Tissue-Specific Effects
Learn More2. Role of polycomb repressive complex 2 in regulation of human transcription factor gene expression
Role of Polycomb Repressive Complex 2 in Regulation of Human Transcription Factor Gene Expression
Learn MoreThe study described here was undertaken with the idea that mechanisms of gene regulation might be revealed by comparing the promoters of genes expressed at a high level with the same regions from weakly expressed genes. Differences in the regulatory regions would be candidates for a functional role in regulatory control. It was recognized at the outset that an attractive strategy would be to compare regulatory regions in broadly expressed and tissue targeted genes. While the control regions of broadly expressed genes would need only signals to activate transcription, those of tissue targeted genes would need to have activating signals for gene expression in some tissues, but repressive signals for control in tissues where the gene is not expressed.
The genes encoding transcription factors suggested themselves as an appropriate experimental system. Approximately 1600 transcription factor genes have been annotated in the human genome, and these include both broadly expressed and tissue targeted genes. It was expected that transcription factor binding sites in the promoters of the two populations would be distinct. The promoters of broadly expressed transcription factor genes would be enriched in binding sites for gene activating transcription factor binding sites (TFBS) while both activating and repressing TFBS would be found in the promoters of tissue targeted genes.
The study was performed with a database of 1018 human transcription factor genes. Of these, 589 (58%) were broadly expressed genes while 419 (41%) were tissue targeted. For each gene, a graphical representation of the promoter TFBS composition was examined visually to identify significant features. The images (from UCSC Genome Browser) revealed that binding sites for POLR2A and EZH2 were asymmetrically distributed in the promoters of broadly expressed compared to tissue targeted transcription factor genes. For example, among 589 broadly expressed transcription factor (TF) genes, 499 (85%) had one or more POLR2A binding sites in the promoter while among 419 tissue targeted TF genes, 246 (59%)had binding sites for EZH2 (see Figure 1a). It was rare to find EZH2 binding sites in the promoters of broadly expressed TF genes (7%) or POLR2A in tissue targeted TF genes (12%).
As a control, an experiment was performed to test whether the asymmetry observed between POLR2A and EZH2 in the promoters of TF genes would also be observed in an unselected population of human protein coding genes. Is asymmetry found only in TF genes, or does it exist more widely? To test the idea, the experiment described above was repeated with an unselected population of all human protein coding genes. Here the results showed a lower percentage of EZH2 compared to POL2A rather than the higher percentage in the TF gene population. The results therefore support the view that the POLR2A/EZH2 asymmetry is found in TF genes only and not in an unselected population of human genes.
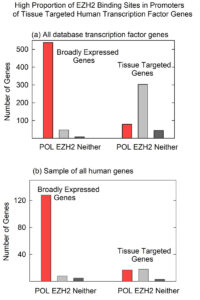
Figure 1: Graphs showing the counts of POLR2A and EZH2 binding sites in broadly expressed and tissue targeted TF genes (a) and similar counts in a control, unselected population of all human genes (b). Note that the proportion of EZH2 binding sites is greater in tissue targeted compared to broadly expression TF genes, but not in the unselected population of all human genes.
Binding of EZH2 to the promoter regions of tissue targeted TF genes as described here was interpreted to indicate that EZH2 acts to repress TF gene expression as a component of PRC2, a complex known to be involved in gene repression. The PRC2 complex is well-suited to attenuate expression of TF genes in tissues where expression is not required. It is consistent with this interpretation that EZH2/PRC2 binding sites are rare in broadly expressed TF genes, genes that need to be expressed in all tissues and therefore do not require repression. The above interpretation is illustrated graphically in Figure 2.
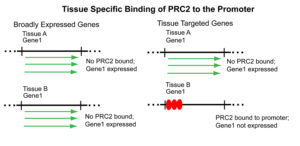
Figure 2: Illustration of how PRC2 is thought to repress tissue targeted genes, but not broadly expressed ones.
Role of Polycomb Repressive Complex 2 in Regulation of Human Transcription Factor Gene Expression
Learn More3. Promoter organization to survive the effects of mutagenic damage
Backup transcription factor binding sites protect human genes from mutations in the promoter
Learn MoreThe promoters of prokaryotic and eukaryotic organisms are significantly different. In prokaryotes (bacteria), one or a very few transcription factors control expression of several related genes at once. These are located near each other and also near the promoter. In contrast, eukaryotic promoters often contain binding sites for hundreds of transcription factors with each promoter controlling expression of only a single gene. Genes with related functions are most often located remotely throughout the entire genome each with its own promoter. Unravelling the mechanisms involved in eukaryotic gene expression will involve unique challenges, and undertaking them is a major goal of molecular biologists worldwide and also the goal of the project described here.
The project here was designed to test the idea that the large number of transcription factor binding sites (TFBS) found in eukaryotic promoters provides backup or redundant promoter function that allows the gene to be regulated normally in the presence of mutations to the promoter. It is proposed that extra TFBS do not function to prevent mutations to the promoter or to repair them once they have occurred. Instead, it is proposed that they enable the promoter to function normally in spite of mutagenic damage.
The study was carried out with 42 human genes each expressed only in brain. The strategy was to focus on individual TF/TFBS pairs in the promoter of each gene. The most abundant TF/TFBS pair was identified by the results of ChIP-seq studies that measure occupancy of each TFBS by its transcription factor. The TF binding level was then accumulated for each of the five most abundant TFBS in all 42 database genes. The levels were then plotted against the gene expression level. The idea of a backup function would be supported if the plots for the most abundant TFBS/expression plot were the same as that for the second most abundant, the third most abundant and so on.
A sample of the data is shown in Table 1. There the TFBS and ChIP-seq levels are shown for the first 7 of the 42 brain genes examined. The TFBS for the most abundant one is indicated in the column labeled tfbs1 and so on for tfbs2-tfbs5. The ChIP-seq signal for each TFBS is indicated to the right of the TFBS name and the column labeled exp1 indicates the gene expression level (from the result of an RNA-seq experiment).
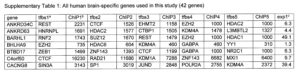
Table 1: Sample of the data used in the analysis of brain-specific gene promoters. Gene names are shown in the column at the far left while expression levels are shown at the right.
Figure 1 shows the plots obtained when the ChIP-seq results were plotted against gene expression for tfbs1-tfbs3. Clear similarities were observed among the three ranks in the expression/ChIP-seq relationship. For instance, in the lower left of the plot the RTP1, PNMA6F and FGF3 genes are found in similar locations in the three abundance ranks. Near the center of the plot, HTR5A, HCRT and TLX3 are located similarly. CACNG8, TBR1 and CREG2 locations are related in all three plots. The results are interpreted to indicate that the three ChIP-seq abundance ranks have the potential to serve in a redundant fashion to drive expression of the genes to the same level.
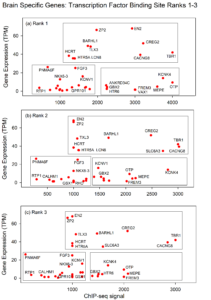
Figure 1: Plot of ChIP-seq signal (x-axis) against gene expression (y-axis) for results accumulated for 42 brain-specific genes (ranks 1-3). Note that points corresponding to individual genes are located in similar locations in the three plots suggesting the presence of backup transcription factors binding sites able to function in the event of mutation to others.
The paper referenced below contains the results described above and also the results of a similar analysis beginning with a database of 31 human genes expressed only in liver. Information is also presented about the TFs identified in brain compared liver gene promoters. Figure 2 below illustrates the way backup transcription factors is suggested to protect gene promoters against the effects of genetic mutations.
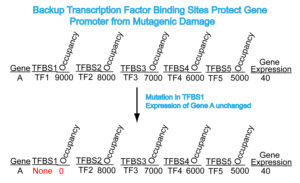
Figure 2: Schematic drawing illustrating the way backup TFBS are proposed to protect promoter function in the event of mutagenic damage. In each TFBS, Occupancy indicates the hypothetical level of binding of the TF to its cognate TFBS. Note that a mutation to TFBS1 (red) does not affect expression of gene A due to the presence of backup TFBS.
Backup transcription factor binding sites protect human genes from mutations in the promoter
Learn MoreBackground of ideas: How is expression of human genes regulated?
Every investigation has a background of ideas that underlie and motivate the experiments performed. Two such ideas underlie the study described here. They are:
1. The level of a gene’s expression is controlled by a combination of the gene’s length and its location in the nucleus where it is transcribed.
2. The role of transcription factors is to determine the tissue where a gene is expressed.
Below is a brief description of the reasons length-plus-nuclear location and tissue targeting are well suited for important roles in human gene expression.
Level of gene expression
There can be little doubt that gene length can affect the level of gene expression. RNA polymerase functions at a finite rate, so it must take less time to create a short mRNA molecule than a long one. Other factors (e.g. pausing) can affect the rate an mRNA molecule is produced, but the length of the template DNA molecule must at some level affect the overall gene expression rate.
The cell nucleus is a large structure when compared to the size of a single gene or a transcription unit. It is reasonable to think therefore that there are regions of the nucleus that differ in their availability of things such as ribonucleotide triphosphates and RNA polymerase molecules required for transcription. Regions with a higher concentration of the materials required for mRNA synthesis may therefore support a higher level of gene expression.
Tissue specific gene expression
All organisms with distinct tissues face the problem of getting some genes expressed in the tissues where they belong and not in others. In view of the number of distinct human tissues where selective gene expression is required, it must be that a large amount of molecular machinery is involved in the sorting process. Transcription factors appear to have the required capacity. Over 1000 have been described in the human genome, and these could be used in combinations to specify tissue-selective gene expression. An experimental test of the above idea has been carried out as a part of this project. A link to the paper is given below.